Principles of data structure
The SOEP started with a basic data structure that is now termed SOEPclassic. The majority of datafiles still follow this basic principle, which is explained in the next section. Since 2012, there is a new concept of SOEP called SOEPlong, where the focus is on the longitudinal nature of the SOEP.
i. SOEPclassic
SOEPclassic contains a multitude of different datasets (in the data distribution of 2012, v28, there were over 300 different files). To get an overview of the data, a somewhat simplified categorization helps: there are datafiles which describe the development of the sample, such that the user knows which person or household was part of the interviewed sample in any given year. Then there are wave specific original data files, which contain the data from each year’s questionnaires without any changes except for very basic consistency checks. To help the user with the data, there also are wave specific generated data. These contain consistently coded variables across all waves with common names, such that the users can easily use this information when combining datasets across waves. The SOEP also provides various data on the respondent’s background, called biographical data. These can conceptually be separated into biographical data which are unchanging (such as information on parent’s education, or data from the mother-child questionnaires) and data which may be updated through changes in a respondent’s life (such as new children in the birth biography, or a job change in the job history). There are also some files in SOEPclassic, which are longitudinal in their nature, containing information from several years in one file, or - in the case of the multiple imputations (MIHINC) - contain several observations per household for one year. Finally, there are some files which cannot be easily categorized - some are one-time datasets, some provide information about the interviewers, some about respondents outside of Germany.
One of the biggest assets of the SOEP data is their longitudinal nature, i.e. repeated observations of the same unit (person or household) over time. There are two datasets which should be the building block of any analysis, as they allow to define longitudinal populations very easily: PPFAD and HPFAD. HPFAD includes all households which have been interviewed successfully at least once. Similarly, PPFAD contains all persons who have ever lived in a household that has participated in the SOEP, i.e. that has been captured in HPFAD, including non-respondents and children. Both datafiles contain one record per household or person, respectively, with wave-specific variables for each year’s survey status. In addition to some time-invariant information (like gender, year of birth, migrant status), these files contain all necessary identifiers to combine other files with PPFAD and HPFAD.
Although they provide essential information, PPFAD and HPFAD alone are of little use for actual analyses. The most often used sources for additional information in SOEPclassic are the cross-sectional data files provided in each survey year (or “wave”) (see Figure 6 for those cross-sectional data files included for all waves).
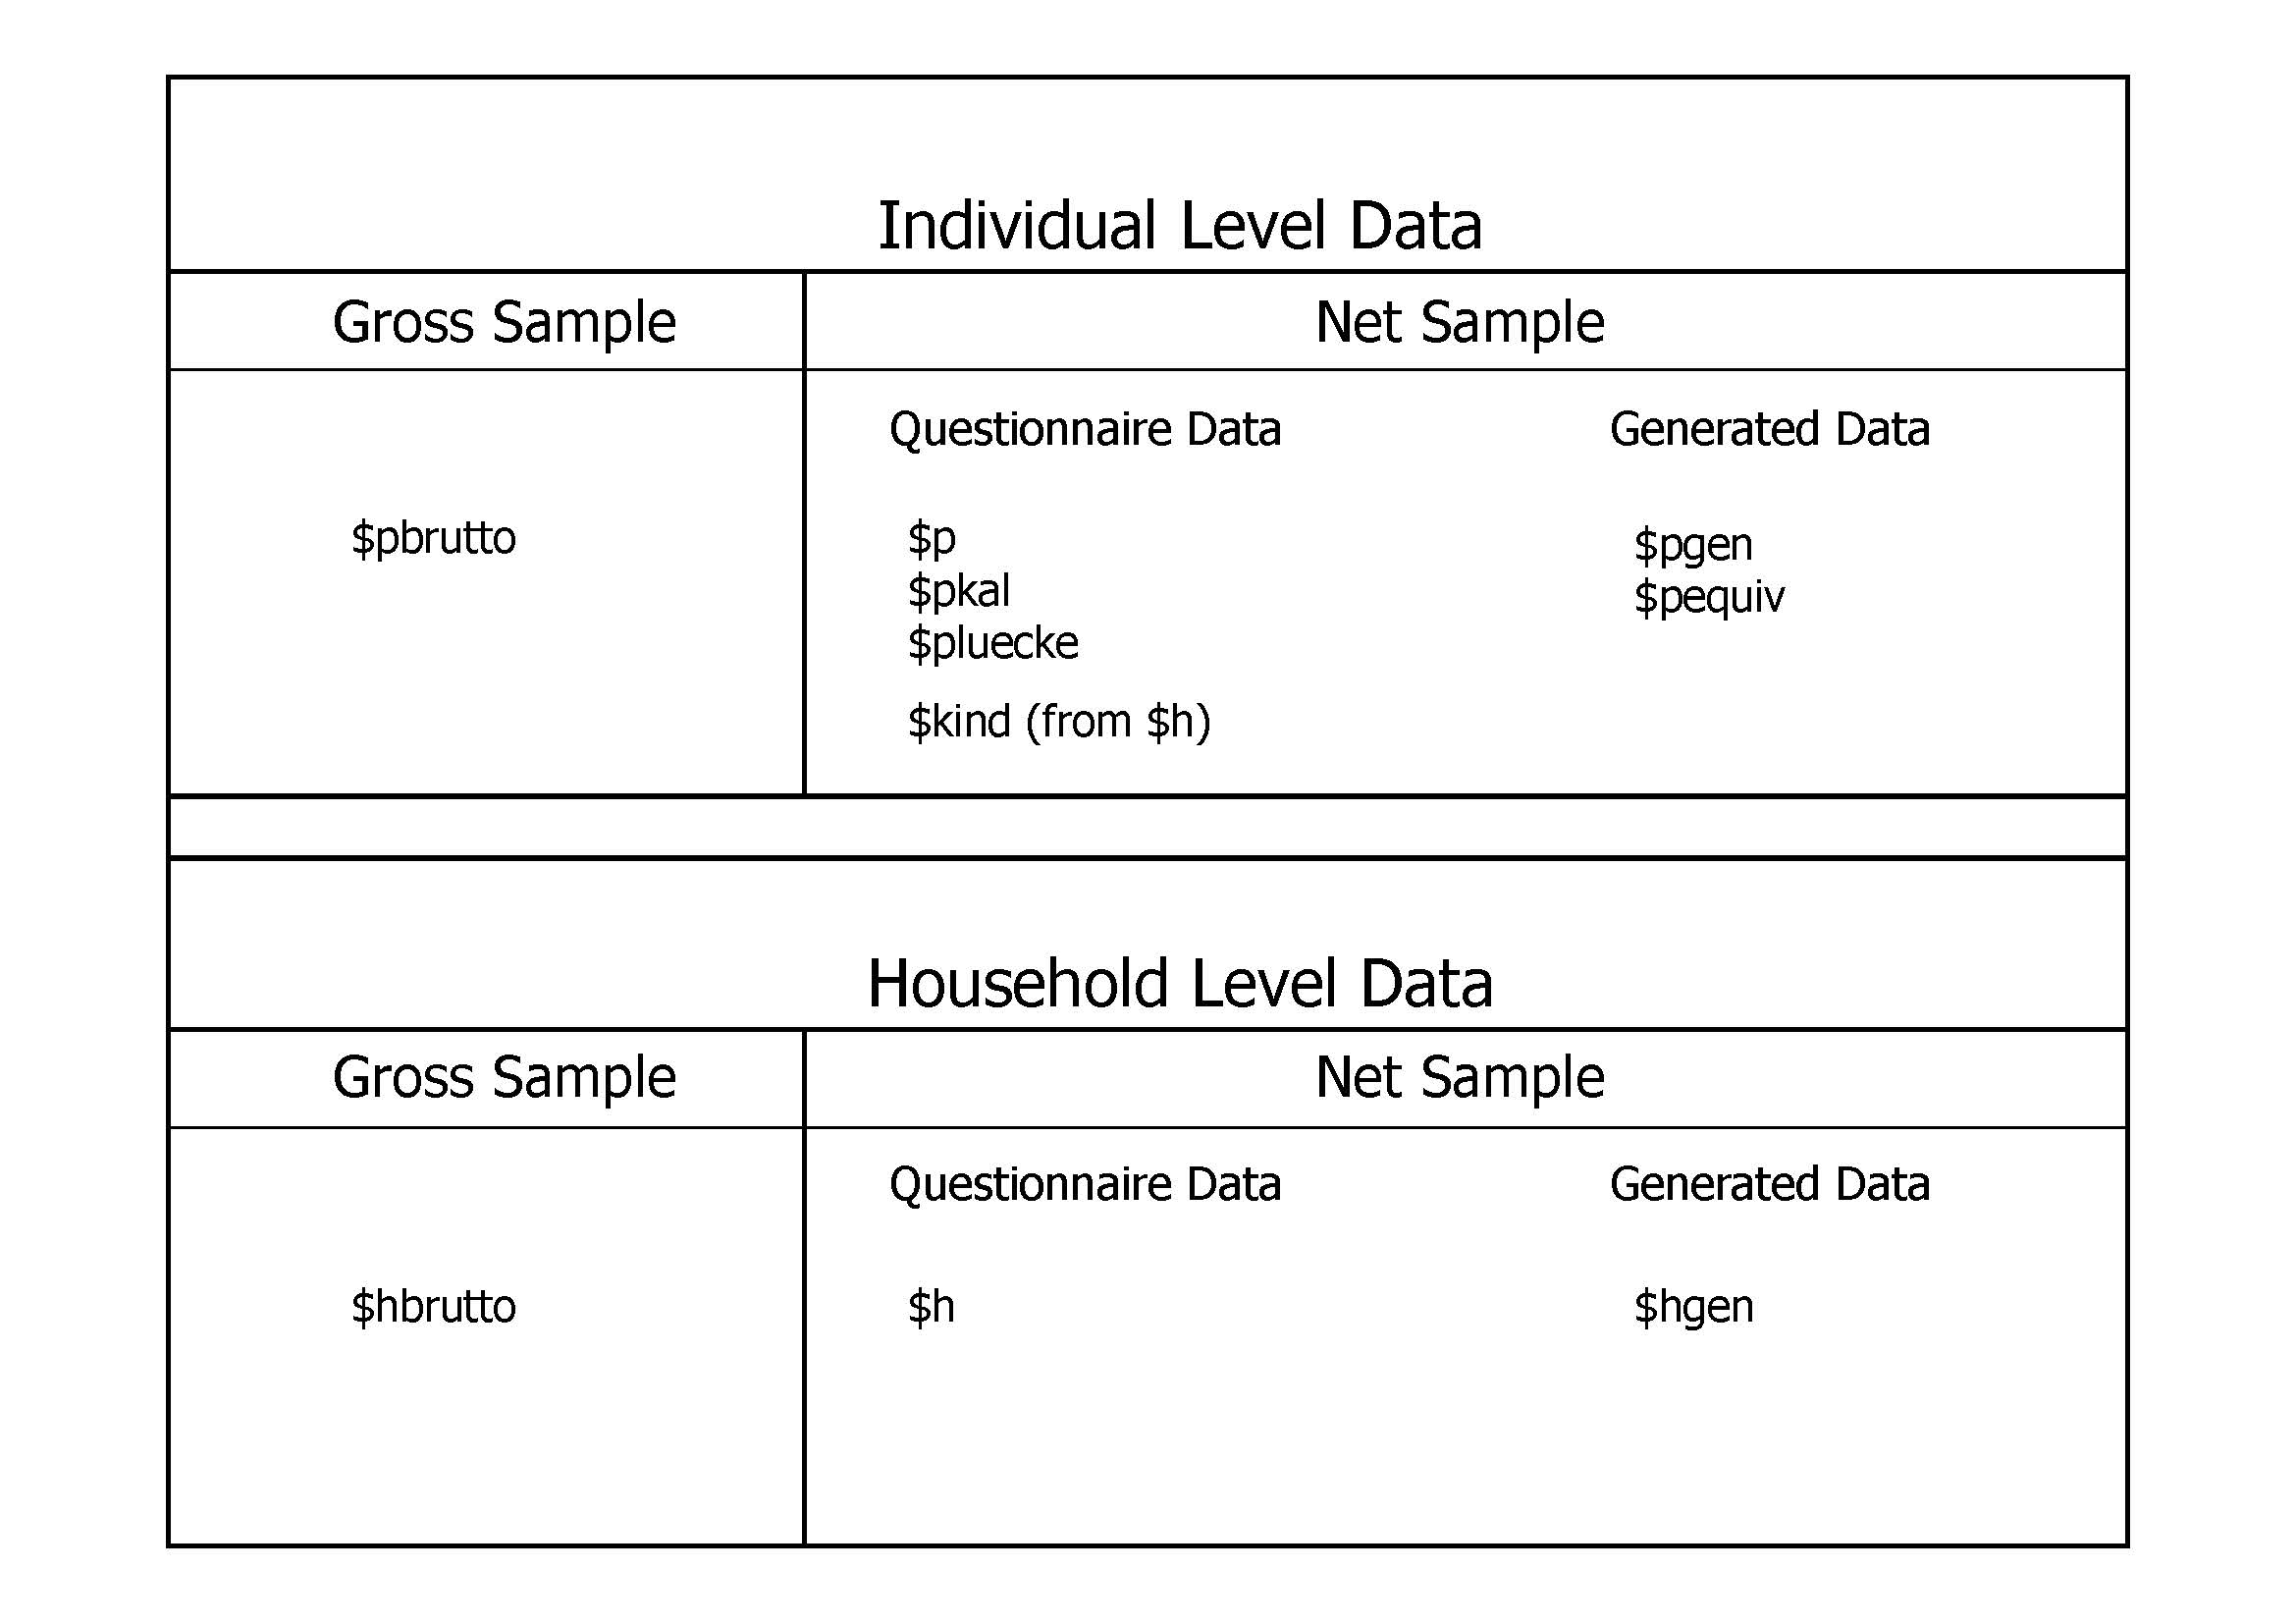
Each wave is identified by letters of the alphabet: the first wave in 1984 is wave “A”, 1985 is wave “B”, and so on, up to BB in 2011. To simplify notation, the “$” sign is used, when all waves of one group of datasets are referred to. For example, $H refers to all household level datasets AH to BBH. For each year of SOEP data there are single data files for households (e.g. $H) as well as for individual respondents (e.g. $P) and children (e.g. $KIND) based on interview information. These observations make up the “net” population, with each of these files containing as many records as interviews could be conducted. Additional data files with a limited number of variables based on the “address log” constitute the “gross” number of households and persons, i.e. all households and their members which were eligible for an interview in any given year.
Figure 6: Cross-Sectional Data Files Included in Every Wave
Each new sample is integrated in the old scheme - hence, for Sample C (East Germans), the first wave of data gathered in 1990 is still labeled “G”, as in the original West German sample. Similar, Sample F starts in 2000 with the letter “Q”, and so on. Even though there are many different samples in the SOEP, for the most part there is only one dataset for each year and topic. For example, the personal interviews recorded in any wave are jointly available for all samples in the $P files. These considerations apply identically to the generated data files, such as $PGEN (user friendly data on the individual level) and $HGEN (user friendly data on the household level).
In addition to the cross-sectional datasets there are datasets which are not wave-specific. These include spell data, which are organized by person and spelltyp (such as ARTKALEN or PBIOSPE. Other files which are not wave-specifc belong to some biography data, e.g. the data on the first job (BIOJOB, or the data on the fertility history (BIOBIRTH)).
Figure 7: Longitudinal Data Files 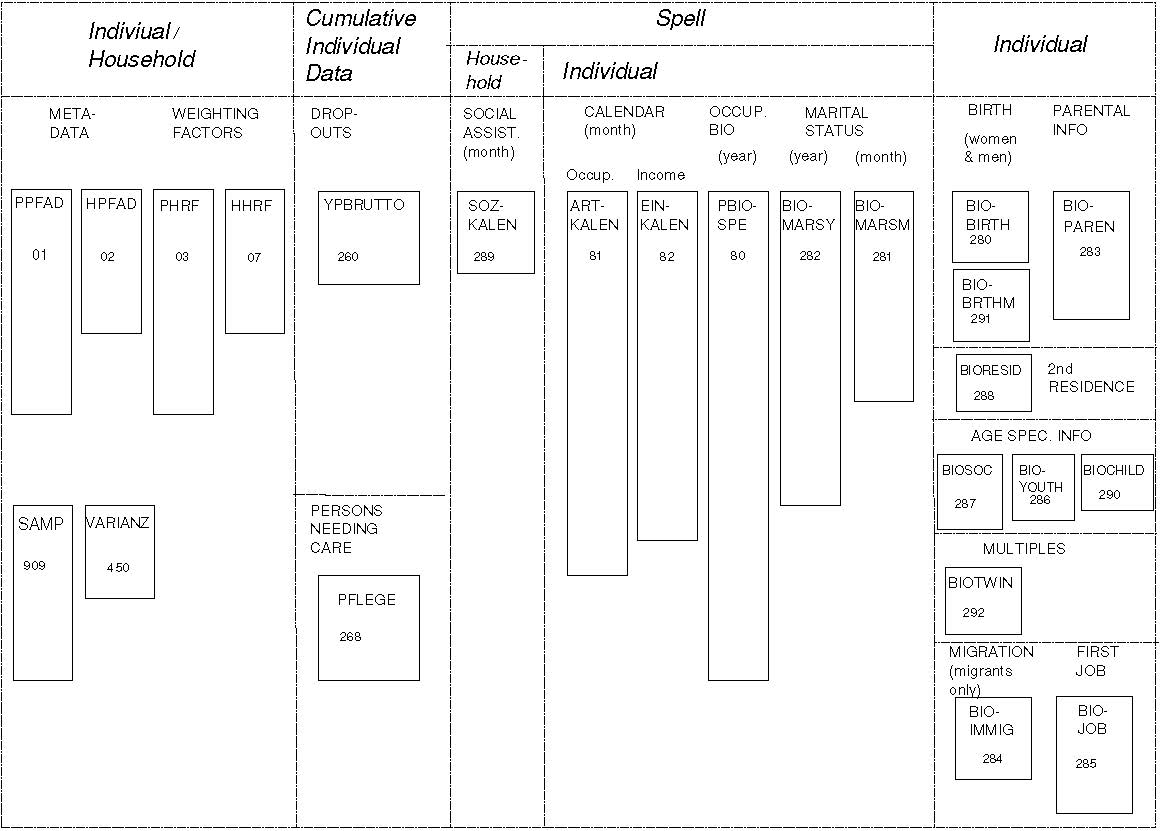
Because of the overall data structure with data on different observational levels, any analysis requires the combination of data using matching or merging procedures. These merging procedures need identifiers such that a combination of datasets becomes feasible. The central individual identifier across time is PERSNR, which is fixed over time (and of course datasets). Since a person might change the household in which he or she lives at any point in time, yearly household identifiers called HHNRAKT are necessary. The exact same information is also stored in $HHNR, allowing easier matching depending on the dataset used. Finally, each individual (respondents as well as children) can be traced back to be a member of or a split-off from an original household of the very first wave. This household’s ID, which is fixed no matter how often a person changes the household in the course of time, is called HHNR. All these identifiers are included in the above mentioned master file PPFAD with the wave-specific household identifiers named AHHNR (for wave 1), BHHNR (wave 2), ..., BBHHNR (wave 28). Figure 8 provides a schematic overview of gross and net samples an how they relate to cross-sectional and longitudinal data.
Figure 8: Relationships between Cross-Sectional and Longitudinal
Populations 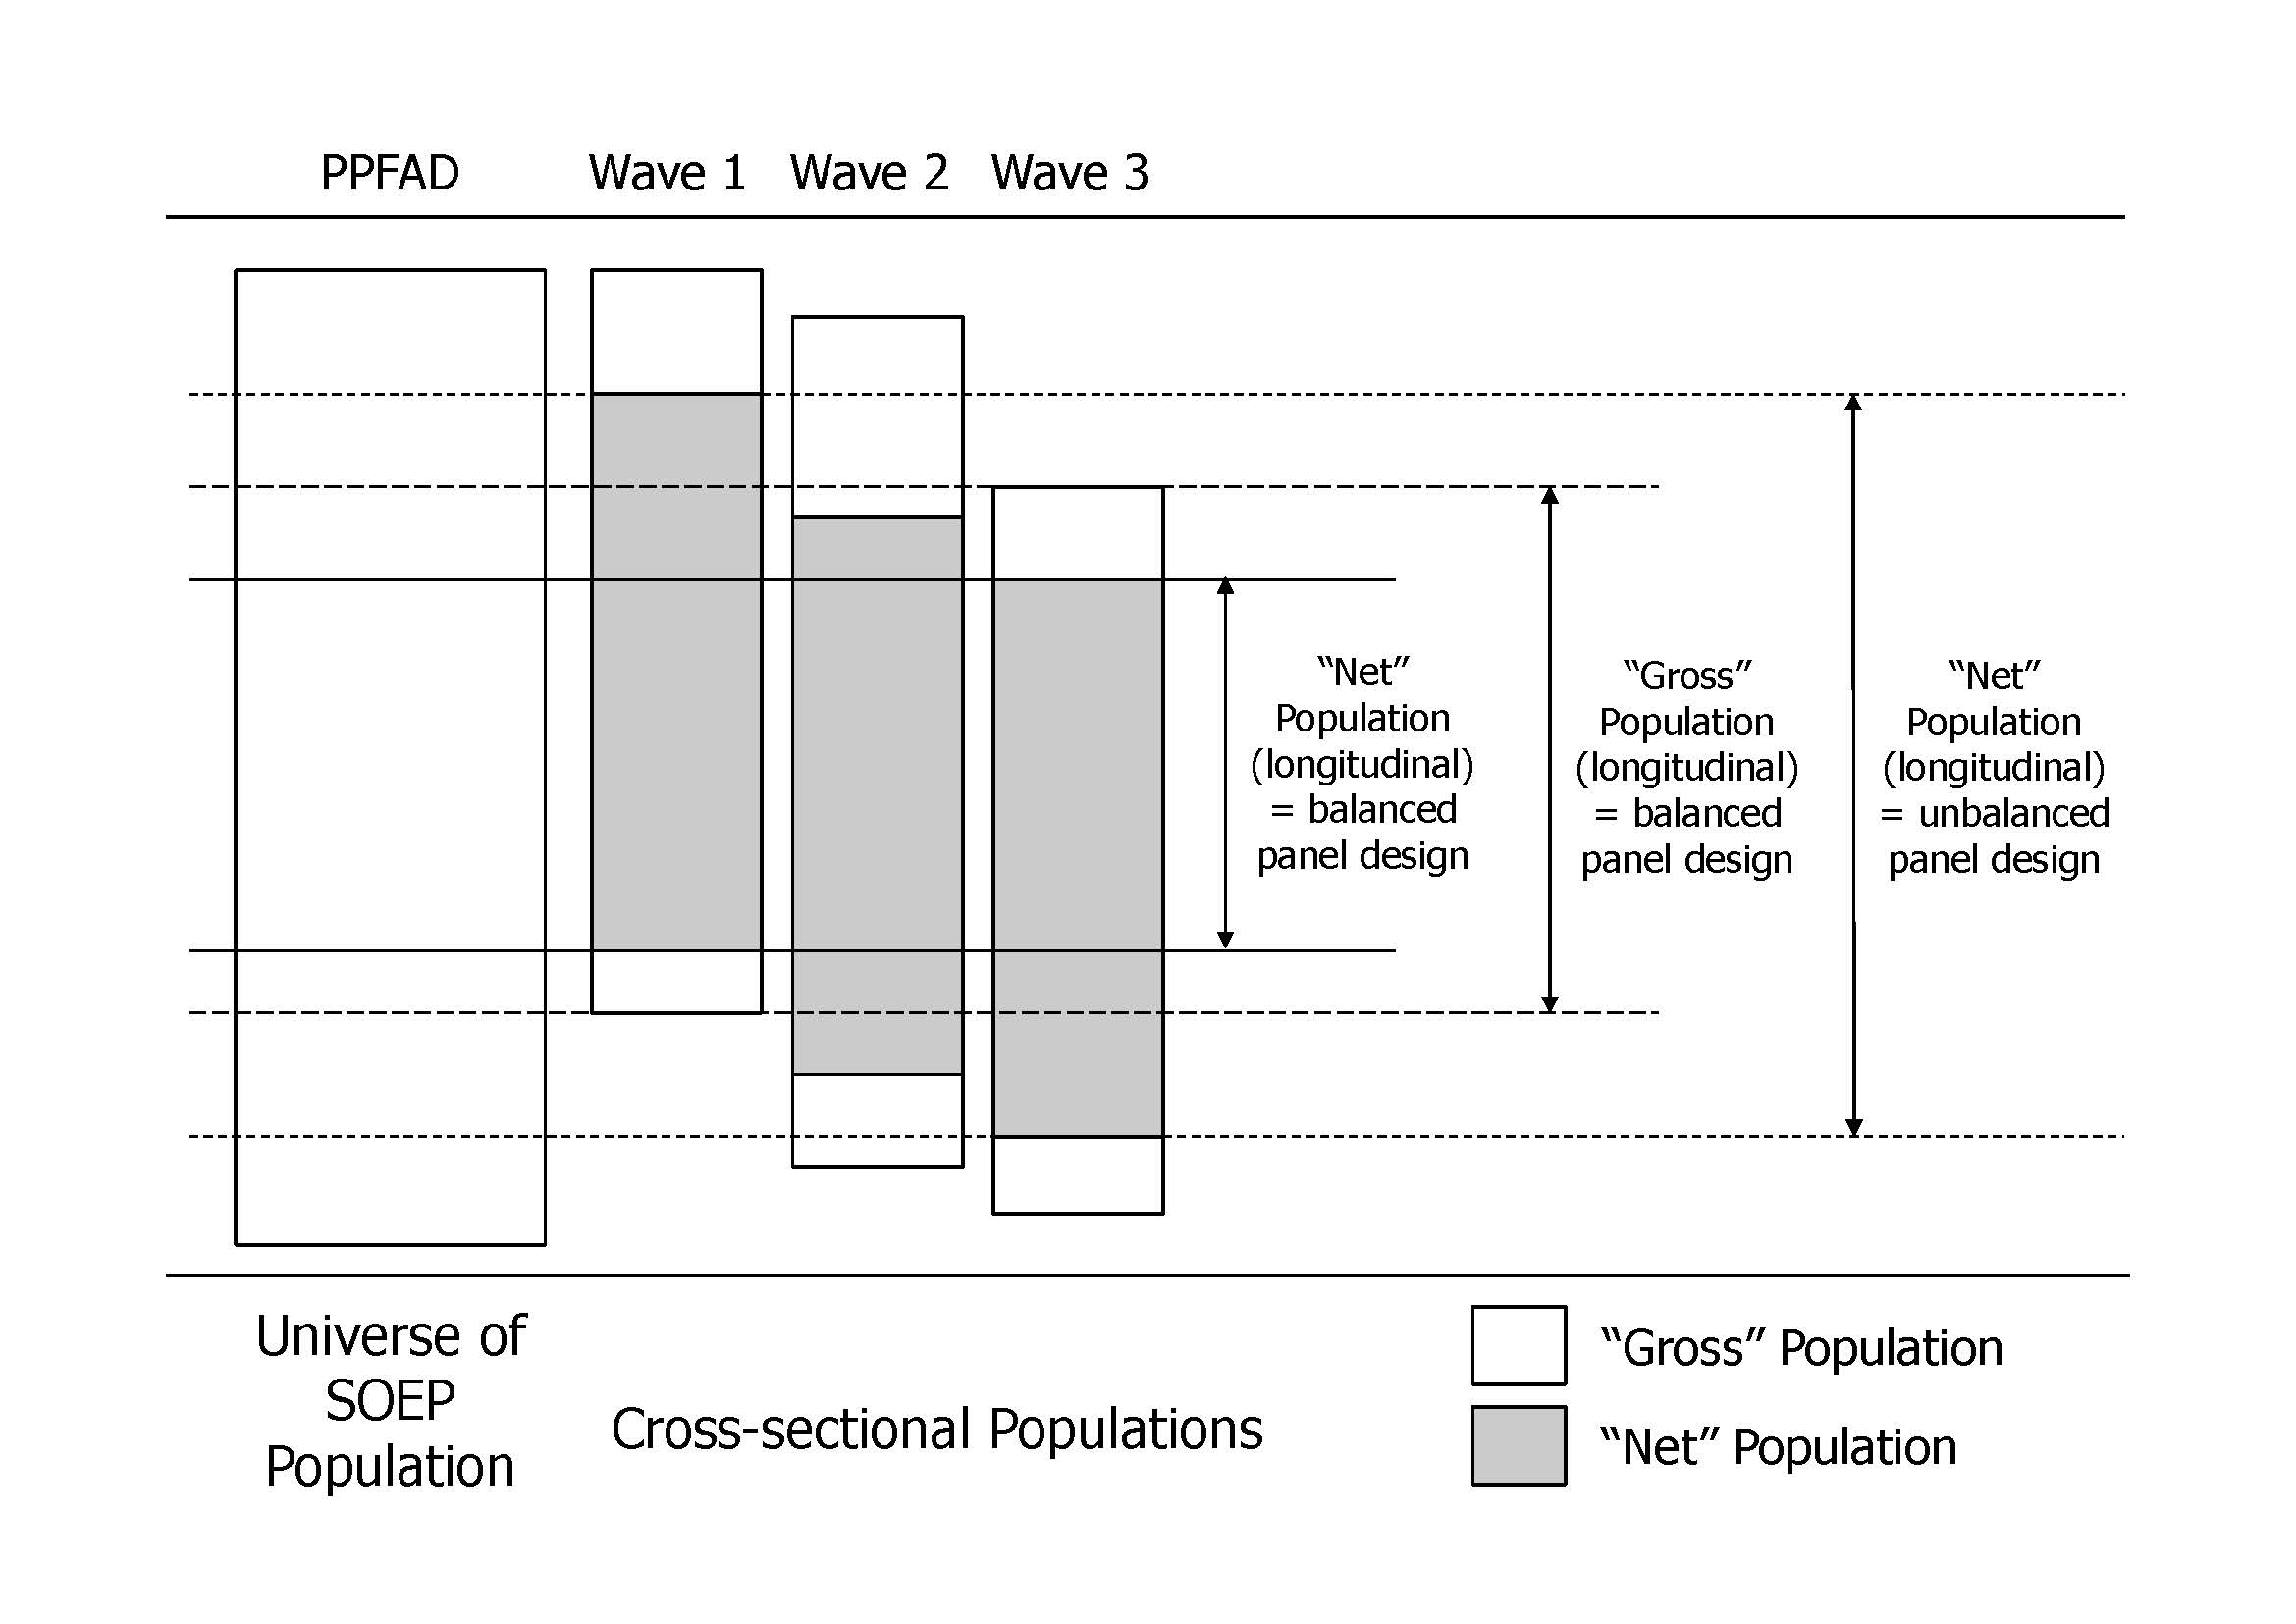
Variable names in the SOEPclassic data files follow basic conventions: First, there are datasets with “speaking” variable names, where the variable name itself conveys something about the information stored in this variable. Most generated datasets follow this convention - e.g. the variable PARTNR$ in the datasets $PGEN contains the person identifier for the respondent’s partner. Second, there are variable names which do not “speak”, but remain identical across the waves up to a wave identifier, e.g. the variable I11102 in the $PEQUIV datasets always contains post-government incomes. Finally, for the original datasets such as $H, $P and $KIND, the variable names are set up “around” the unit of analysis (individual - “p”, household - “h”, and child - “k”) and show before this indicator the wave in which the data were collected and after it the reference of where in the original survey instrument the question can be found (see Figure 9 for an overview). For example, in the dataset AP, the variable AP06 refers to the person questionnaire in wave “A” (1984), question 6.
Figure 9: Variable Naming Conventions for $H, $P and $KIND 
Table 5: Variable Names
| Digit | Meaning |
|---|---|
| 1 | Wave (A for 1984, B for 1985 ... ; according to West samples) e.g. the “A” in AP06 |
| 2 | Unit of analysis (H=household, P=person) e.g. the “H” in AH27 |
| 3-4 | Number of question in original survey instrument (questionnaire) e.g. the “57” in AP57 |
| 5 or 7 | indicating sample specific question (A=sample B, O=sample C due to the fact that “A” is the first letter of the German word Auslaeander which means foreigner and “O” is the first letter of Ostdeutscher which means East German) e.g. the last “A” in AP62A, or the letter “O” in HP42O |
| or 5 | indicating questions in different versions of the questionnaire for first-time or new respondents (Blue version of the questionnaire) and those who have already been interviewed before (Green version) - only for 1985-1993 e.g. the “G” in BP27G06, or the “B” in DH26B01 |
| or 2 thru 8 | text for variables in $PBRUTTO, $HBRUTTO, $PGEN, and $HGEN files e.g. BHHGR, the household size in wave 2 |
| 1 thru 8 | text for variables in $PGEN and $PEQUIV e.g. PARTNR88, the PERSNR of partner, wave 5 e.g. I1110204 , annual post-government income in wave 21 |
Note that starting with wave BA in 2010, the variable names change accordingly, i.e. an extra digit needed to be added for all variables names since then. As the space restriction to 8 digits is not an issue for modern computers anymore, future releases of the data may introduce new rules of naming the data.)
ii. SOEPlong
“SOEPlong” is a highly compressed, easily analyzed version of the SOEP data that, according to numerous enthusiastic users, is much simpler to handle than the usual version. The data are no longer provided as wave- specific individual files but rather pooled across all available years (in “long” format). An overview about the connection of the datafile between the two SOEP formats are avvilabel in Table 6. In some cases, variables are harmonized to ensure that they are defined consistently over time.
For example, the income information provided up to 2001 is given in euros, and categories are modified over time when versions of the questionnaire have been changed. All these modifications are clearly documented and described for ease of understanding. In the case of recoding or integration of data (for example, datasets specific to East German or foreign populations), documentation is generated automatically and all modified variables are provided in their original form as well.
SOEPlong thus provides a well-documented compilation of all variables and data that is consistent over time. It thereby significantly reduces both the number of datasets and the number of variables. Our main structural tracking files $PFAD and $PHRF are also provided in a merged “long” form—in other words, weighting factors are a ready integrated into PPFADL and HPFADL.
And for the first time, a beta version of so-called “enumerated weights” [PHRFE] is provided in PPFADL, particularly for the analysis of household characteristics on the individual level.
Further variables included in the “long” format of the PFAD dataset are:
- The variable IYEAR (interview year) - which corresponds to the variable DATUMY in HBRUTTO - to mark the actual interview year, supplementing the variable SYEAR (survey year, referring to the reference year for the survey instrument).
- In addition, the generated partner IDs (PARID, PARTNER) are also included in PPFADL (to supplement the corresponding PGEN variables, allowing partners to be identified in households where one partner could not be interviewed).
A further addition to the “long” format of the SOEP data are the cumulative original data from the biographical questionnaire from the BIO dataset.
Preparation of the SOEPlong format also includes all datasets that are provided regularly as cross-sectional files. In generating the individual and household data in the SOEPlong format from the original survey data, comprehensive information is also generated from the cross-sectional variables documenting the long variables over time. This allows users to see what adaptations had to be made in variables over time and verify the variables’ comparability.
Table 6: Matching of SOEPlong and cross-sectional datasets from SOEPclassic
| SOEPlong | SOEPcore |
|---|---|
| ppfadl | ppfad, phrf |
| hpfadl | hpfad, hhrf |
| pbrutto | |
| hbrutto | |
| pl | ap, ..., zp, bap, bbp, ... |
| hl | ah, ..., zh, bah, bbh, ... |
| kidl | kidlong (akind, ..., zkind, bakind, bbkind, ...) |
| pgen | apgen, ..., zpgen, bapgen, bbpgen, ... |
| hgen | ahgen, ..., zhgen, bahgen, bbhgen, ... |
| pkal | apkal, ..., zpkal, bapkal, bbpkal, ... |
| pequiv | apequiv, ..., zpequiv, bapequiv, bbpequiv, ... |
| bio | biolela, mlela, ..., zlela, balela, bblela, ... |
The “long” data are being provided, as in previous years, for users of different data formats: Stata, SPSS, and SAS (and in the unlabeled ASCII format). In addition, an English version of all datasets is being made available.
The first complete documentation on the SOEPlong format is the first content being made available in the new version SOEPinfo (“DDI on Rails”). It also is provided there in graphic form.
iii. Missing conventions
Survey variables might be missing, i.e. without a valid code or value for different reasons. In the SOEP, negative values are not valid for any variable, but are used instead to code different reasons for missing information. There are two distinctions for missing values: they may originate in the respondent’s answer or in the survey design. The respondent may refuse or not know an answer or she may report invalid values on the one hand, and the interview design may exclude respondents with certain characteristics from some questions on the other (e.g. men will never be asked if they are pregnant). The following codes apply both for SOEPclassic and SOEPlong, also shown in Table 7:
- A person might refuse to answer a question, which happens more often in sensitive questions (e.g. income related questions), or may just not know the answer to a question. In such a case, the missing code is “-1” for “no answer / don’t know”. Note that the SOEP does not distinguish between the refusal to answer and a true “don’t know”.
- Information may be missing when a question is not asked because it is not relevant for a specific person, e.g. owner-occupiers will not be asked about the amount of rent they pay. In such cases, the question “Does not apply” to this person, and the variable receives a code of “-2”.
- Sometimes invalid answers are encountered, when respondents fill out a PAPI interview themselves or the interviewer mistypes an answer, e.g. persons cannot work more than 168 hours a week. In such a case, multiple checks are carried out, and if the inconsistency remains, the variable is recoded “-3 Implausible value”.
- Some questions contain multiple answer possibilities, where the respondents are asked to pick one and only one answer. In the SOEP PAPI instruments, sometimes respondents ignore this request and provide more than one answer, e.g. they mark “very good” and “good” when asked about their current health status. In such cases, if the correct answer cannot be determined from the questionnaire itself, the code “-4 Invalid Multiple Answers” is given to this variable.
- With the extension of the SOEP in recent years, entirely new samples have been added to the core. In these samples, sometimes questions are left out completely, e.g. to shorten the questionnaire or because the focus of the sample is different as in some of the related studies. In such a case, the variable will be set to “-5 Not included in this version of the questionnaire” for an entire subsample.
- With the use of CAPI, recent developments include an “integrated” person questionnaire, i.e. the biography part and the “regular” part of the questionnaire are asked as one. Some of the questions in the biography part are repeated in the regular part. While in the PAPI mode, the respondent will answer the same question twice, the CAPI allows to filter the respondent around the question if it has already been asked. These cases are very rare - if they occur, they receive a code “-6 Version of questionnaire with modified filtering”.
Table 7: Missing Values
| Code | Meaning |
|---|---|
| -1 | no answer / don’t know |
| -2 | does not apply |
| -3 | implausible value |
| -4 | Inadmissable multiple response |
| -5 | Not included in this version of the questionnaire |
| -6 | Version of questionnaire with modified filtering |
| -8 | Question not part of the survey program this year*| |
*Only applicable for datasets in long format.